The year is nearing its end, so it's time to reflect on 2013.
My porfolio is up approx 35 % (defined in my case as the internal rate of return, XIRR function of excel), so I can't hardly complain.
However some of the Small caps value funds I follow are doing much better: see this link (video in French):
Independance et Expansion is up ~60 %, HMG Decouvertes up ~40 %, Sextant PEA ~37 %, Moneta Micro entreprises (closed to new subscriptions) ~ 36%.
As a consequence, I've had a hard time recently finding interesting stock picks (and the blog has remained quite silent). Same thing with convertible bonds, risk aversion is sharply down whereas it was possible to find a good yield on some thinly traded convertibles only 6 months ago.
This may be compounded (in France) by the creation of the PEA-PME, a tax shelter (a rarity these days) reserved for European small cap stocks.
It also seems to me (but I haven't bothered to quantify this) that IPO's
are back in Euronext Paris, especially for med-techs. The small caps
are also quick to react to news (publications,...) whereas a few months
ago the market was quite inefficient and it was possible to buy a few
shares before the news had spread.
My favorite gurus have issued what I consider to be warning signals (this applies to the US markets, more richly valuated than Europe, but still...)
Hussman funds
Howard Marks
Jeremy Grantham
In a next post, I'll review my tops and flops and try to draw some lessons for next year.
And Happy Christmas to everybody.
jeudi 19 décembre 2013
mercredi 2 octobre 2013
Nexeya buyout offer
I own some shares of Nexeya (ALNEX), bought between 5 and 8 € in 2012.
I never made a post on Nexeya but Nate at oddballstocks did.
Nexeya is currently making a tender offer at 12 € for minority shareholders.
Nexeya released yesterday the details on its offer (link, in French only I fear), at the same time as its 2013 financial accounts.
It's interesting to look at the offer for 2 reasons :
- the actual decision to sell or not,
- it's very instructive to look at the independant expert valuation and methodology, to improve mine but also to have an idea about what to expect in future comparable buyouts.
The document is 76 pages long, I'll try to make a shorter post !
The independent expert is a member of Crowe Horwath network.
The independant expert uses DCF and comparables analysis.
Any approach based on book value is judged irrelevant by the expert for a company like Nexeya. The offer values Nexeya on a P/B ~0.7 (based on 2013 HY accounts) or P/B~0.9 (based on 2013 final accounts, after a ~20 goodwill depreciation has conveniently depressed book value).
1st lesson: never assume that the minimum buyout offer will be at book value (even for a company that's been profitable for the last 7 years, median ROE~10 %).
DCF analysis
I show only the final table:

The main hypothesis built into this model are :
Cost of capital 12.2 % (based on WACC stuff :link); I routinely use 12 % as my "base rate". So no bad surprises here.
Projected EBIT margin 7.3 %, which is more that the average past margins and 2010 peak margin at 7.1 %. So again a slightly optimistic but reasonnable assumtion.
Modest future growth, again a reasonable assumption.
Then comes net debt :
 3.2 m€ for apparently unfunded pension liabilities (after taxes), a good reminder to not forget those in my own evaluation.
However, if we have a look at the most recent published accounts (annual accounts, June 2013), and if I'm not mistaken
short term debt 5.2 m€, LT debt 7.6 m€, cash 16.0 m€ => excess cash 3.2 m€ vs
1.1 net debt according to the independant expert !!!!!!
Where did all this cash go in just 3 months ?
I have not found the answer. I suspect that it is used to finance the buyout, thus depressing the tender offer price. Neat, isn't it ?
Correcting for this only, without changing the rest, would make the DCF estimate go from 12.5 €/share to around 13.5 €/share.
Comparable companies
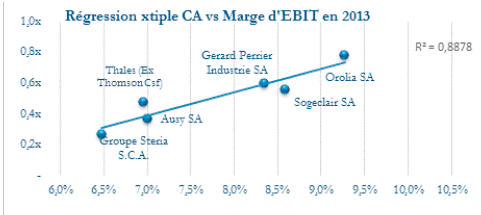
This graph plots EV/Sales vs EBIT margin, using 2013 expected results.
You can always discuss if the companies are actually comparable (Steria provides information technology services, not quite close to Nexeya), but that's not the point.
Based on this "regression analysis", and Nexeya 7.3 % EBIT margin, the expert computes a "fair"value for Nexeya.
Then, because Nexeya is a smaller company than the mean of the sample used here, the expert applies a 15 % discount on this :

No fundamental reason other than an empirical observation on market cap size effect on valuation.
Let's have a look at the comparables market cap

This one reminds me of the "Bill Gates walks into a bar" example about the distinction between
the mean and the median value of sample. With Thales in the sample, we can be quite sure that Nexeya market cap is smaller than the mean.
Another issue (but I don't feel like going on, it is late) are the projected results/margins used for the comparables ; I checked some and I found significant discrepancies between projected and actual known 2012 data, often leading to a higher projected price for Nexeya "fair" price.
Conclusion
I've not made up my mind yet. I need to cool down a little.
This confirms my first impression about a lowball offer.
However I'm not sure I want to stay invested in a company where the managers interests are evidently not aligned with mine, and maybe severe liquidity issues in the future. Besides, I'm not sure if there is some dilution around the corner or not.
I want to make some further observations.
Given the path of Nexeya stock price (IPO at around 17 €, buyout at 12 € ~seven years later), this reinforces my rule of thumb to never participate to an IPO, which is a pity because I view it as one of the few useful functions of the stock market for the "real" economy.
This also justifies why you need a large margin of safety compared to a "fair price", maybe even more so for small caps maybe given this kind of tender offers, especially when no strong minority investor (independent mutual fund, activist shareholder,...) is present at the capital.
I never made a post on Nexeya but Nate at oddballstocks did.
Nexeya is currently making a tender offer at 12 € for minority shareholders.
Nexeya released yesterday the details on its offer (link, in French only I fear), at the same time as its 2013 financial accounts.
It's interesting to look at the offer for 2 reasons :
- the actual decision to sell or not,
- it's very instructive to look at the independant expert valuation and methodology, to improve mine but also to have an idea about what to expect in future comparable buyouts.
The document is 76 pages long, I'll try to make a shorter post !
The independent expert is a member of Crowe Horwath network.
The independant expert uses DCF and comparables analysis.
Any approach based on book value is judged irrelevant by the expert for a company like Nexeya. The offer values Nexeya on a P/B ~0.7 (based on 2013 HY accounts) or P/B~0.9 (based on 2013 final accounts, after a ~20 goodwill depreciation has conveniently depressed book value).
1st lesson: never assume that the minimum buyout offer will be at book value (even for a company that's been profitable for the last 7 years, median ROE~10 %).
DCF analysis
I show only the final table:
The main hypothesis built into this model are :
Cost of capital 12.2 % (based on WACC stuff :link); I routinely use 12 % as my "base rate". So no bad surprises here.
Projected EBIT margin 7.3 %, which is more that the average past margins and 2010 peak margin at 7.1 %. So again a slightly optimistic but reasonnable assumtion.
Modest future growth, again a reasonable assumption.
Then comes net debt :
However, if we have a look at the most recent published accounts (annual accounts, June 2013), and if I'm not mistaken
short term debt 5.2 m€, LT debt 7.6 m€, cash 16.0 m€ => excess cash 3.2 m€ vs
1.1 net debt according to the independant expert !!!!!!
Where did all this cash go in just 3 months ?
I have not found the answer. I suspect that it is used to finance the buyout, thus depressing the tender offer price. Neat, isn't it ?
Correcting for this only, without changing the rest, would make the DCF estimate go from 12.5 €/share to around 13.5 €/share.
Comparable companies
This graph plots EV/Sales vs EBIT margin, using 2013 expected results.
You can always discuss if the companies are actually comparable (Steria provides information technology services, not quite close to Nexeya), but that's not the point.
Based on this "regression analysis", and Nexeya 7.3 % EBIT margin, the expert computes a "fair"value for Nexeya.
Then, because Nexeya is a smaller company than the mean of the sample used here, the expert applies a 15 % discount on this :
No fundamental reason other than an empirical observation on market cap size effect on valuation.
Let's have a look at the comparables market cap
This one reminds me of the "Bill Gates walks into a bar" example about the distinction between
the mean and the median value of sample. With Thales in the sample, we can be quite sure that Nexeya market cap is smaller than the mean.
Another issue (but I don't feel like going on, it is late) are the projected results/margins used for the comparables ; I checked some and I found significant discrepancies between projected and actual known 2012 data, often leading to a higher projected price for Nexeya "fair" price.
Conclusion
I've not made up my mind yet. I need to cool down a little.
This confirms my first impression about a lowball offer.
However I'm not sure I want to stay invested in a company where the managers interests are evidently not aligned with mine, and maybe severe liquidity issues in the future. Besides, I'm not sure if there is some dilution around the corner or not.
I want to make some further observations.
Given the path of Nexeya stock price (IPO at around 17 €, buyout at 12 € ~seven years later), this reinforces my rule of thumb to never participate to an IPO, which is a pity because I view it as one of the few useful functions of the stock market for the "real" economy.
This also justifies why you need a large margin of safety compared to a "fair price", maybe even more so for small caps maybe given this kind of tender offers, especially when no strong minority investor (independent mutual fund, activist shareholder,...) is present at the capital.
lundi 16 septembre 2013
Stockopedia review
Version Française : à venir.
Intro
I’ve been
recently offered a trial subcription to Stockopedia and it gave me the
opportunity to test their stock screener.
This is my
review. I’m of course grateful for this gift, however I’ll try to be unbiased.
Being French and the Stockopedia founders British, I’ll also try not to add to
our national reputation of arrogance (largely unfounded of course).
The
investment process looks more or less like this (value and opportunity blog
copy/paste)
A) Stock
screening & quick analysis
B) Deeper Analysis
C) Buy decision (or not buy)
D) Sell at some point in time
B) Deeper Analysis
C) Buy decision (or not buy)
D) Sell at some point in time
Obviously
we’re talking about step A).
Currently
I’m using a personal “database”, basically just a bunch of Excel sheets. Every
time I look at a stock, I make a spreadsheet, and I try to update it (with new
financial releases) when I look again at the stock a few months/years later.
Why Excel ?
I already have the software, I know how to use it, you can draw graphs, make
some personal calculations, keep some notes on the company you’re looking at
(for instance why you invested/did not invest in this company ; it’s always
funny and self-sobering to look back at your decisions and thought process a
few months/years later).
Currently
this “database” is around 12 Gb (and clearly Excel was not meant for that, I do
have some crashes from time to time) and the manual updating process is quite
(meant as a British understatement) laborious. And the other hand, it forces me to read the annual report,
look at the accounts, try to make sense of them, in short it forces me to make
the transition from a stock to a real-life company.
Crash test of the stockopedia stock screener
I do use
stock screeners from time to time to generate ideas, because my database is not
exhaustive and I can easily miss opportunities.
There is much much less
coverage and screeners for the French market compared to the US and UK markets. The only free one I
know is the FT screener (link), and it’s pretty rudimentary, but, hey, it’s
free.
The stockopedia screener is neatly presented and is pretty intuitive to use (and anyway who bothers reading manuals, these days?).
The stockopedia screener is neatly presented and is pretty intuitive to use (and anyway who bothers reading manuals, these days?).
A wide choice of ratios and financial metrics (ratios based on earnings, sales, FCF, debt, growth,…) is available and furthermore you can combine them. Actually you’re offered with so many choices that I felt kind of overwhelmed at first. But I think the designers have foreseen this and some simple “push button” screens following a well-known strategy are also built-in. The nice thing is you can start from this base and tweak it to build a custom screen.
Once you’ve
selected your database, you run the stock screener and voilà !
A feature I
like is that you download your results in excel or other file (pdf, csv,
xls,…) for further analysis offline.
So let’s do
a crash test on the French market; to start I used a simple EV/EBIT ranking
(actually the inverse ratio = earnings yield, defined by stockopedia as
operating profit / enterprise value).
Here is
what you get (only part of the list).

On this
list, there are many companies I’ve invested in or looked closely as buying
opportunities, or covered by other value blogs: ADL Partner (see article here), GEA (see article here),
STAL (see article here), Maisons France Confort (MFC, see
article here, or ennismore funds description here), just to name a few.
I checked
the numbers against mine and published results and found them generally
accurate, so it means that the database is reliable (more on that below). The
database seems also to cover the French stock exchange pretty exhaustively.
Minor bugs
It’s
interesting to look at the top companies of the EV/EBIT list.
Promeo sold
a division in 2012, thus boosting the operational result. The actual Promeo
financial statements make the distinction between current operational
results and operational results but the screener uses only the operational
result, hence the artificially low EV/EBIT ratio.
Same thing for Richel Serres (company makes greenhouses). It sold a major subsidiary last year, thus boosting the net result, but not the operational result, or Interparfums (perfume maker ; current operational result 58 m€ vs 213 m€ for Stockopedia ; the difference is due to an exceptionnal settlement after the termination of a contract/licence with Burberry).
I was NOT
surprised NOT to see CIFE (ticker INFE) high in the list. The company has
roughly double the cash reported by stockopedia, but it’s hidden in the
non-current assets (see my old article here), and a stock screener can’t know
that.
However I don't want to make the impression that the database is flawed. For the other companies I checked, the numbers were correct and up to date.
Other features
Of course you can build a much more elaborate screen,
blending price/value indicators (earnings yield,…) vs “quality” indicators
(whatever that means for you : high ROE, ROA, ROCE or operating margin or net
margin, or FCF yield, just to name a few).
Stockopedia has a built-in pretty
elaborate ranking engine. As I said previously you can always use this as a
template and build your own. Here’s a screen shot :

I own a lot of shares of companies in this list (Infotel, Gerard Perrier, Linedata, Neurones, MFC, ) and have seriously looked at most of them as possible
buy candidates (LSS, PUS, LCO,...), so from my point of view (meaning my own buying criteria) , I find the results rather impressive.
I'm also surprised by the large number of companies on this list in the Computing Services Sector (INF, LCO, OSA, SOP, NRO) ; I don't know if it's the result of an actual undervaluation or the result of the choice of screening criteria.
I know that there's a sizeable difference between operational and net result for these companies because of taxation issues (specific to these companies that pay lots of salaries but with little supplies/raw material costs), so some careful double checking is needed here.
Conclusion
To sum it
up I think the screener is a very useful tool that gives you a solid list to
narrow the choices and start digging deeper.
I've also been impressed by the reactivity of the Stockopedia team to answer requests and fix bugs.
I wouldn’t
rely on the screener results alone to make the decision to invest, and I don’t
think it is Stockopedia goal either but it’s a tremendously time-saving tool.
I think
also this is very useful when trying to expand your investment horizon outside
your home market. I remember a Buffet article / interview saying that at the
beginning of his career he started looking at all the US stocks one
by one alphabetically. I doubt I would have the patience and available time to
apply this method for the UK
or German stock markets, which are pretty large.
dimanche 30 juin 2013
GEA : the signal or the noise ?
The title refers, of course, to the book by Nate Silver, that I'm currently reading.
The Signal and the Noise
I like the book a lot (even though the chapters about baseball are hard to follow if you don't know the game) and recommend it.
GEA has recently offered me a good opportunity to think about how to filter the signal from the noise.
The facts (as objectively as possible)
I covered the fundamentals of GEA in a previous post : here and here.
Recently GEA published its HY results (here, in French only).
Earnings are in line with the previous year.
Cash now amounts to 54 m€, for a market cap of 88 m€ (73 € last quote). 0 debt. So EV/2012 EBIT ~2, super cheap for a company with apparently strong margins in a niche market.

So I was tempted to add to my position (and I did, much higher than 73 € though).
But :
At the end of the news release, GEA announces a 57 m€ backlog, a dramatic decrease from 75 m€ last year, even though GEA says at the end of the release that new orders have been booked since, notably in export markets.
The stock started a rapid descent the next day :

I treated this as noise but the "market" apparently thinks otherwise, and it's causing me sufficient concern to revisit my decision and the process (or lack thereof) behind it.
I'll write it down here and it will be interesting to revisit here in a few months.
I guess that most of my readers will have been in a more or less situation and would like to hear their thoughts on how they treat such situations.
So, signal or noise ?
On this graph I've plotted the backlog and actual sales of GEA for the last few years.
It makes sense that backlog and sales are highly correlated.
Last time the backlog dropped around 2007, the sales did follow a few months later, although they dropped much less. And a one occurrence sample makes for poor statistics...

Hypothesis 1
Recent order book drop is a fluke; current valuation is a steal. Sellers are wrong. Buy.
Hypothesis 2
Recent order book drop is highly significant. It's an indication of a large future drop in sales. I'm the idiot for trying to "buy the dip".
After all, many recent infrastructure projects have been recently cancelled in France, not good for GEA business.
Moreover, management does not say anything about this, which shows a serious lack of communication and deserves a higher valuation discount rate.
If we correlate the order book and the sales, we could expect future sales to be around 50 m€.
It also seems possible to assume that the margin will decrease and revert to its long term mean (around 11%).
This means an EBIT of around 6 m€, so an EV/EBIT ratio of around 6, not exactly a nosebleed valuation either, and certainly not a reason to dump the shares as brutally as happened ?
At the last shareholders meeting, some shareholders tried to have a special dividend voted, but the owning family blocked this. So maybe some are considering that the large excess cash of GEA is locked out, and that it deserves an additional discount ?
Conclusion
I can't really make sense of this brutal drop, but I'm maybe missing something or fooling myself ? And after all value investing is not about trying to make predictions about next year earnings, but rather putting the emphasis on valuation. I think GEA is a bargain at current prices, but time will tell.
The Signal and the Noise
I like the book a lot (even though the chapters about baseball are hard to follow if you don't know the game) and recommend it.
GEA has recently offered me a good opportunity to think about how to filter the signal from the noise.
The facts (as objectively as possible)
I covered the fundamentals of GEA in a previous post : here and here.
Recently GEA published its HY results (here, in French only).
Earnings are in line with the previous year.
Cash now amounts to 54 m€, for a market cap of 88 m€ (73 € last quote). 0 debt. So EV/2012 EBIT ~2, super cheap for a company with apparently strong margins in a niche market.
So I was tempted to add to my position (and I did, much higher than 73 € though).
But :
At the end of the news release, GEA announces a 57 m€ backlog, a dramatic decrease from 75 m€ last year, even though GEA says at the end of the release that new orders have been booked since, notably in export markets.
The stock started a rapid descent the next day :
I treated this as noise but the "market" apparently thinks otherwise, and it's causing me sufficient concern to revisit my decision and the process (or lack thereof) behind it.
I'll write it down here and it will be interesting to revisit here in a few months.
I guess that most of my readers will have been in a more or less situation and would like to hear their thoughts on how they treat such situations.
So, signal or noise ?
On this graph I've plotted the backlog and actual sales of GEA for the last few years.
It makes sense that backlog and sales are highly correlated.
Last time the backlog dropped around 2007, the sales did follow a few months later, although they dropped much less. And a one occurrence sample makes for poor statistics...
Hypothesis 1
Recent order book drop is a fluke; current valuation is a steal. Sellers are wrong. Buy.
Hypothesis 2
Recent order book drop is highly significant. It's an indication of a large future drop in sales. I'm the idiot for trying to "buy the dip".
After all, many recent infrastructure projects have been recently cancelled in France, not good for GEA business.
Moreover, management does not say anything about this, which shows a serious lack of communication and deserves a higher valuation discount rate.
If we correlate the order book and the sales, we could expect future sales to be around 50 m€.
It also seems possible to assume that the margin will decrease and revert to its long term mean (around 11%).
This means an EBIT of around 6 m€, so an EV/EBIT ratio of around 6, not exactly a nosebleed valuation either, and certainly not a reason to dump the shares as brutally as happened ?
At the last shareholders meeting, some shareholders tried to have a special dividend voted, but the owning family blocked this. So maybe some are considering that the large excess cash of GEA is locked out, and that it deserves an additional discount ?
Conclusion
I can't really make sense of this brutal drop, but I'm maybe missing something or fooling myself ? And after all value investing is not about trying to make predictions about next year earnings, but rather putting the emphasis on valuation. I think GEA is a bargain at current prices, but time will tell.
vendredi 26 avril 2013
Vivendi 2012 annual results update
I already wrote about Vivendi several times :
in sept 2011 : here
updated mid 2012 : here
Vivendi published its 2012 annual results recently, so it's time for an update.
Besides some people apparently arrive on this blog after a google search on "vivendi value" so I feel more or less compelled to update.
However, if you look for a clear-cut investment thesis and a strong conviction, you'll not find it there, so you may want to skip this post in that case.
Intro
Vivendi 2012 annual result presentation is here.
You'd never know casually looking at the slides that earnings are down a whooping 94 % (see for instance slide #3 all those nice green check boxes).
I also love the expression "maximize SFR value". What is that supposed to mean ?
SFR CEO Frank Esser was fired in 2012 and Vivendi CEO Mr Levy himself stepped down mid 2012.
Both have left with 3.9 m€ golden parachute as disclosed in the financial report (note 25 Transaction with related parties).
Remember also that the dividend was cut in half last year and not restored since.
Now that I've vented some of my bitterness, I'll try to decide rationally what to do.
What happened ?
The reality (as I see it) is that SFR (mobile phone branch of Vivendi) margins have been steamrolled by the competition with Free (ticker : ILD). Free mobile has gained 5.2 million new clients in just one year. SFR had to lower its prices and create low-cost offers to stabilize its customer base. Same thing has happened to the telecom branch of Bouygues.
According to rumors, Vivendi is currently looking for a new CEO for SFR (5 managers in 5 years), a pretty good indication of the current malaise (I might as well use a French word from time to time).
Here is a graph with the stock price of Free (ILD) vs Vivendi (VIV) for the last 5 years, that speaks for itself.

If I take my personal example, I left SFR for Free mobile in 2011. As I previously explained, my bill went from 14.9 € to 2 € for 1 hour (enough for my needs).
Early 2013 Free mobile upgraded me from 1 to 2 hours, for the same 2 € ! A striking example of a 50% price deflation in stark contrast with other goods/services around me.
I'm a Vivendi client for my ADSL connection. They offered me spontaneously a 10% rebate on my monthly fee, as a loyalty bonus.
Mutliply that by a few million clients and obviously this is not good for the bottom line.
2012 financial results
Updated graph

CA = Chiffres d'Affaires = Sales
ROP = Operational Result
I don't take into account the adjusted EBIT published by Vivendi, which is always higher.
FCF = CFO (cash flow from operations) - CAPEX
LT debt = long term financial debt
Flat sales, margins are down, FCF down (heavy investments). Only positive aspect I see is LT debt is -at last- stabilized.
EV/current EBIT ~13, hardly cheap.
The net result is impacted by provisions and depreciations.
Equity is around 20 bn€, and goodwill around 25 bn€, so there are many "opportunities" for further depreciations in the future.
Sure enough, it's a non-cash loss, but I think it is misleading : see this link.
Analysis of a screw up
Can I reasonnably assess the "earnings" power of VIV ? Not really.
I can't predict the evolution of the telco industry in France (and the arrival of Free did significantly change the landscape).
Seems like operators are betting on the arrival of the 4G standard to restore their margins, but large invesments are required and imho there's no guaranty hat a new price war will not resume after a few months.
This post (value and opportunity blog) clarifies (I think) the kind of mistake I made. I bought VIV in 2011 because it looked cosmetically cheap (based on recent past earnings) but without really understanding why. Obviously this is more difficult for a large company operating in different sectors, subject to relatively rapid changes.
To compound this, VIV is a large cap followed by many professional investors, so I have obviously no informational or analytical edge.
Insider trading

Insider trades taken from the AMF website, superposed on the graph of VIV stock.
Blue = buys
Red = Sells
Amonts in € (logarithmic scale).
I see no clear correlation here (ie no heavy buying at bottoms, no heavy selling either). Anyway nothing but buys since end 2010.
A recent significant buy from Bollore (800 k€ in march 2013) who as has a reputation of a shrewd operator. Also and maybe related, a recent operation by Bollore that I don't quite understand :
Bollore is borrowing 310 m€ using 17 millon Vivendi shares as collateral (so ~18.2 €/share) ?
What does it mean for Vivendi ?

Sum of parts analysis
Here is my own crude version.
Every professional analyst who follows VIV has probably a much more refined one, so I won't fool myself about any superior insight, but at least it gives me a rough idea.
All figures in m€.

Some subsdiaries (Activision, Maroc Telecom) of Vivendi are listed, so I just use the market cap (at the time the article was written).
Vivendi recently tried to sell GVT but no deal. I use for my valuation the highest rumored bid : around 6 €bn.
For SFR I used a simple comparison (EV/Sales ratio) with Belgacom, another telco (listed in Brussels) I happen to follow and France Telecom. I used the lowest valuation of the two.
For Canal+, EV/Sales comparison with M6 (ticker MMT), a French TV company I follow (I own a few MMT shares). Sure it's not the same business model (Canal+ is pay TV), but I wonder if/how he arrival of Netflix (not yet, but bound to happen sooner or later ?) on this market will impact C+.
For Universal media group, I just applied the same EV/EBITDA ratio of 7 (the same as the UMG/EMI deal) and slapped a 20 % discount on this, just in case UMG overpaid for the deal.
I substract the net debt and divide by the diluted number of shares.
I get ~20€/share for this sum of parts valuation.
In this article, the consensus average valuation was 19.35 €, a good agreement, but difficult to know if it's just a coincidence, without access to the analysts notes. In this article (in French), Soc Gen sum of parts valuation is 22 €.
Anyway the current quote (~17 €) is a 15 % discount to 20 € which does not seem so large to me (I have in mind a 20-30 % "usual" holding discount here).
Conclusion
As I said, I have no edge here.
No obvious under evaluation.
No trust for management.
No hurry to sell either because of the discount to sum-of-parts analysis.
Vivendi has announced recently that it has received two offers for the sale of Maroc Telecom and the stock went up as a result.
I've sold part of my position at 17 € and will continue to do so when (if) the stock goes up. Otherwise no move.
lundi 18 février 2013
Total (FP) 2012 update
I 1st coved Total in August 2011 : see here.
The company has just published its 2012 results.
The company was (and is) extremely cheap on a PER or EV/EBIT basis and raised its dividend.
However my main concern at that time was that Total was, as stated by Jim Chanos for integrated oil companies, in "stealth liquidation".
To summarize Jim Chanos: "we are shorting oil majors. If you look at their accounts you will see that capital expenditure (CAPEX) consumes all the cash generated, yet their reserves and their sales have stagnated. This means that they borrow to pay their dividend. They are in fact in liquidation.
This did not stop me from investing at 32€, mainly for the hefty dividend yield (7%).
The stock is now around 37 €.
So is Total in "stealth liquidation" ?
Here is a graph with
- Operating cash flow (flux d'activité in French)
- CAPEX (more on that later)
- FCF = operating cash flow - CAPEX
- FCF - dividend
This last one turned negative in 2009 and stayed there.
Score one for Chanos.

Lets now look at :
- long term debt (left scale)
- production and reserves (right scale)
Debt climbs, flat production, flat reserves.
Shows also that all CAPEX can be considered as maintenance CAPEX (0 growth).
Score another one for Chanos.

Same graph but debt expressed as a % of equity (left scale).
Well debt does not seem to explode.

Summary :
The "liquidation" term seems rather excessive to me.
But a dividend durably exceeding FCF is imho unhealthy.
Standby for me, I don't know quite what to do !
The company has just published its 2012 results.
The company was (and is) extremely cheap on a PER or EV/EBIT basis and raised its dividend.
However my main concern at that time was that Total was, as stated by Jim Chanos for integrated oil companies, in "stealth liquidation".
To summarize Jim Chanos: "we are shorting oil majors. If you look at their accounts you will see that capital expenditure (CAPEX) consumes all the cash generated, yet their reserves and their sales have stagnated. This means that they borrow to pay their dividend. They are in fact in liquidation.
This did not stop me from investing at 32€, mainly for the hefty dividend yield (7%).
The stock is now around 37 €.
So is Total in "stealth liquidation" ?
Here is a graph with
- Operating cash flow (flux d'activité in French)
- CAPEX (more on that later)
- FCF = operating cash flow - CAPEX
- FCF - dividend
This last one turned negative in 2009 and stayed there.
Score one for Chanos.
Lets now look at :
- long term debt (left scale)
- production and reserves (right scale)
Debt climbs, flat production, flat reserves.
Shows also that all CAPEX can be considered as maintenance CAPEX (0 growth).
Score another one for Chanos.
Same graph but debt expressed as a % of equity (left scale).
Well debt does not seem to explode.
Summary :
The "liquidation" term seems rather excessive to me.
But a dividend durably exceeding FCF is imho unhealthy.
Standby for me, I don't know quite what to do !
jeudi 31 janvier 2013
GEA 2012 annual results
GEA has published its 2012 results.
The financial report is available here (in French).
Margins remain high (23 % op margin); no tangible sign of "mean reversion" as was (and still is) my main concern.
Modest sales growth, stable order backlog.

The balance sheet remains rock solid (40 m€ cash, 0 debt).
Working capital requirement shows a marked increase (large increase in accounts receivable) but I see not cause for concern.
In my previous article I had mentionned that GEA was not part of the "Ecomouv" consortium implementing a new tax for trucks ; but according the the latest report GEA will be a supplier after all.
I had also mentionned that Sanef had bought the transport branch of Communication and Systems (CS group), a comparable company. Finally the branch has been sold for 15 m€, around 0.5x 2012 Sales, or 10x 2011 operational result.
All in all, nothing very new.
Positives : strong balance sheet, profitable, cheap (EV/current EBIT ~3)
Negatives : slow growth, some indifference to shareholders (no special dividend, no share buybacks).
I've bought some more shares.
The financial report is available here (in French).
Margins remain high (23 % op margin); no tangible sign of "mean reversion" as was (and still is) my main concern.
Modest sales growth, stable order backlog.
The balance sheet remains rock solid (40 m€ cash, 0 debt).
Working capital requirement shows a marked increase (large increase in accounts receivable) but I see not cause for concern.
In my previous article I had mentionned that GEA was not part of the "Ecomouv" consortium implementing a new tax for trucks ; but according the the latest report GEA will be a supplier after all.
I had also mentionned that Sanef had bought the transport branch of Communication and Systems (CS group), a comparable company. Finally the branch has been sold for 15 m€, around 0.5x 2012 Sales, or 10x 2011 operational result.
All in all, nothing very new.
Positives : strong balance sheet, profitable, cheap (EV/current EBIT ~3)
Negatives : slow growth, some indifference to shareholders (no special dividend, no share buybacks).
I've bought some more shares.
jeudi 10 janvier 2013
Bilan 2012
Meilleurs voeux à tous.
Best wishes to all, english translation of the following post to come...
2012 a plutôt été une bonne année boursière, et pour mon portefeuille également.
Mais une performance annuelle n'a pas beaucoup de sens je trouve. Difficile de faire la différence entre hasard et véritable discernement sur une si courte période.
D'autre part on avait fort mal commencé 2012, sur des perspectives de fin de l'€, de défaut de l'Espagne, de l'Italie, etc...Les valorisations étaient au plancher. Comme le pire n'est pas arrivé, tout est plus ou moins remonté, y compris les actions de mon portefeuille.
Je me méfie du consensus haussier de début 2013. Rien n'est véritablement réglé, et je pense que les résultats des sociétés ne vont pas s'améliorer cette année, bien au contraire. Donc prudence.
Ci-joint un mémo récent de Howard Marks. "I think this is a time for caution".
Pour moi, la "performance" est à réaliser lors de d'achat, en achetant les actions de la "bonne" société au "bon" prix (ou au bon moment), et surtout en utilisant le "bon" processus.
Je préfère donc passer rapidement en revue mes précédents posts (dans l'ordre chronologique) pour avoir une idée plus juste de mes "performances".
INFE : 58 € en Février 2011, 50 € fin 2011, 45 € fin 2012.
Pas brillant du tout, donc.
Les résultats se sont fortement détériorés mi 2012, mais la société a toujours un bilan en béton et une valorisation à la casse. La liquidité est quasi inexistante. On se demande bien ce que la société a l'intention de faire de son abondante trésorerie.
Je reste confiant, mais à surveiller de près. Je ferai un post à l'occasion des résultats annuels.
SAM Outillage (SAMP) : 32 € en Février 2011, vendu à 44-45 € fin 2011. Cours actuel 28 €.
Donc apparemment une bonne décision.
Je la surveille du coin de l'oeil, sans plus.
Total (FP) : 32 € en Aout 2011, allégé à 39 € fin 2011. Cours actuel 39 €.
Fond de portefeuille.
Vivendi (VIV) : 16 € en Septembre 2011. Cours actuel 16,4 €.
Toujours plus de dettes au bilan et guerre des prix avec Free. Départ du PDG. Succession de spéculations ce été sur la vente de telle ou telle division (Maroc Telecom, GVT, etc...). J'attends les résultats de 2012 pour décider.
Tessi (TES) : 62 € en Novembre 2011. Cours actuel 80 €.
Je reste confiant dans la société, même si les résultats seront en baisse je pense (problèmes dans la division Marketing, voir mon post ici).
Groupe CRIT (CEN) : Achetée 20 €, moyenne baisse à 14 €, et 11 €. Vendue partiellement à 15,9 € début 2013. Donc mauvaise décision initiale, meilleure ensuite. Pas mal d'acquisitions dans le travail temporaire aux US et des notes d'analystes favorables en ce début d'année.
J'ai allégé ma position car je n'ai pas de convictions très fortes. En plus la fiscalité de CRIT (taxe CVAE) est particulière et je l'avais sous-estimée dans mon analyse initiale.
LaCie (LAC) : Achetée 3,5 €, OPA de Seagate à 4,05 € (voir mon article ici), relevée ensuite à 4,5 €, mais Seagate n'a pas réussi à acquérir les 95 % nécessaires pour délister LaCie. Cours actuel 4,1 €. J'ai donc eu raison de ne pas apporter à l'OPA à 4,05 € et pour l'instant apparemment tort de ne pas apporter à celle à 4,5 €. Je ne desespère pas que Seagate améliore son offre pour pouvoir acquérir les actions qui lui manquent.
FFP (FFP) : 25 € en Juin 2012. Cours actuel 32 €.
Pour l'instant le marché me donne raison, mais je pense que FFP a simplement suivi la forte hausse de UG en ce début d'année (rachat de positions à découvert ?). Je vise une réduction de la décote de holding de FFP.
GEA (GEA) : 65 € en Septembre 2012. Cours actuel 72 €.
Un bon achat, donc. Mais toujours difficile pour moi de comprendre si les marges de GEA sont durables ou pas, et surtout pourquoi.
Inscription à :
Articles (Atom)